
How to Accurately Calculate the Performance Impact of Module Cleaning
- Willow Energies

- Jan 13
- 4 min read
Updated: Mar 25

In today’s blog we start with three important statements:
Regular module cleaning should be planned in to O&M strategy on all solar PV installations to ensure optimal output.
Rain doesn’t sufficiently clean modules, particularly those with low tilt
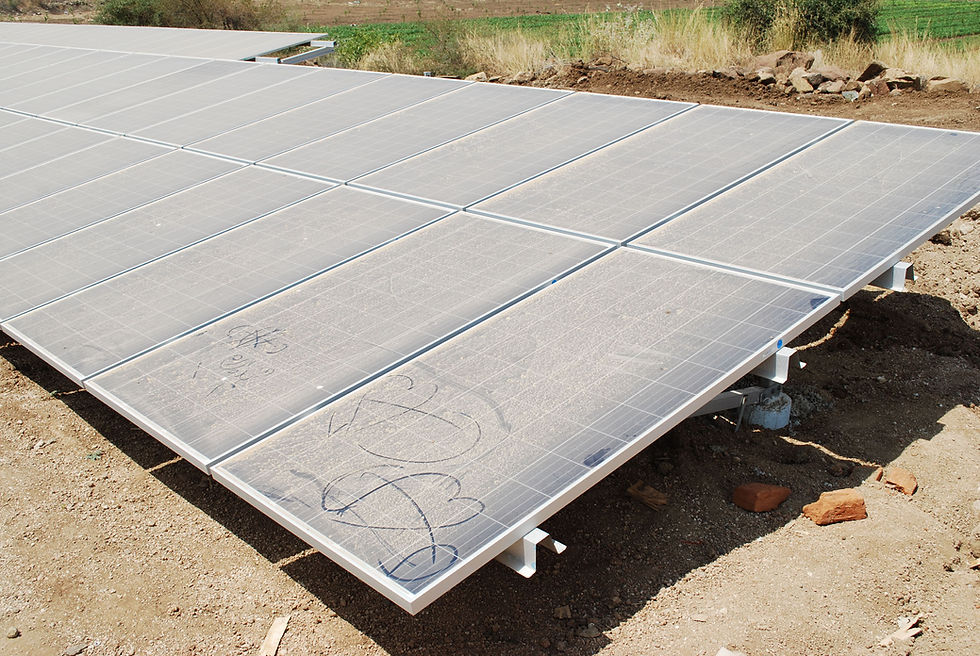
No-one can look at a dirty module and say accurately how much production is being lost from soiling.
Optimal module cleaning strategy
The decision on when and how often to perform module cleaning varies slightly from site to site and region to region:
Sites in industrial areas will typically require more cleaning which can be up to monthly or even higher frequency, depending on the exhaust fumes of nearby factories
In tropical areas it doesn’t make sense to clean during the wet season, it makes sense to clean just before the wet season to remove any grime and then the rain will be sufficiently frequent to clean the modules
In dry seasons it is necessary to increase the frequency of cleaning as there will be more dust depositing on the modules
So we see that a cleaning strategy is not a linear “clean every 3-6 months”, it requires some planning into when the seasons are and what the local conditions are like.
It’s important to experiment a bit with module cleaning to work out the optimum strategy. For example it is useful to test different (module manufacturer approved) products; many contractors use water but on some sites with rubber dust or even worse, cement, products like Chemitek might be required.
I/V curve measurements
In order to calculate the performance impact of module cleaning we use I/V curve measurements (Current/Voltage measurements). These I/V curve measurements should be done at the module level and not the string level (unless the whole string is cleaned). This means safely disconnecting the reference module(s) from the string to then connect the I/V tracer to perform the testing.
The general process with I/V curve measurements is to vary resistance to work out the optimum combination of current and voltage where the maximum power point (mpp) is highest. Then we need to compare this actual mpp to the expected module power curve (less any module degradation). We perform this process on a module before and then after cleaning, with the % difference being the performance impact from soiling.
Soiling will have an impact on the short circuit current (Isc) of the module as soiling affects the amount of light reaching the cells, which has more of an impact on current than voltage. The Voc will largely remain unchanged but the current reduction will reduce the mpp and thus the module performance. This is illustrated on the chart below.

What we want to find out with the I/V curve measurements is:
1. What is the instant % performance gain of module cleaning
2. How long does that % performance gain last
For point 1 we can find this out immediately, for point 2 we need to repeat the I/V curve process over a period of time to see how performance progresses. The results of points 1 and 2 will help to define your module cleaning strategy.
Testing conditions
The weather on the day of testing is critical, the irradiance should be as close as possible to 1000W/m2 and ideally at least over 800W/m2. This is because the results obtained need to be converted to Standard Test Conditions (STC) of 1000W/m2, so being far away from 1000W/m2 leads to extrapolation errors.
Converting obtained results to STC (1000W/m2, 25C cell temperature, 1.5 air mass) is also critical to ensure a normalisation of results from different times of day/conditions.
Plan testing based on weather forecasts, and avoid testing during:
Passing clouds
Unstable irradiance conditions (e.g. cloudy, rain)
Early morning or late afternoon (changing air mass)
High wind conditions (module temperature fluctuations)
Testing process
The test process is relatively simple:
Firstly you or a contractor need an I/V curve tester such as a PVPM 1040C (as an example) which also includes an irradiance sensor and a module temperature sensor. This equipment should all be calibrated and the same equipment used for all testing.
Choose two modules that will be used for the testing. These modules should be easy to access, free of shading and located next to each other
One module is the reference module, this is left uncleaned
The other module is the test module, this is cleaned
Safely disconnect the reference and test modules from the string using qualified personnel, PPE and isolation procedures
Attach the irradiance sensor in the same tilt and orientation as the modules being tested, and attach the module temperature sensor to the back of one of the tested modules.
Perform I/V curve measurements on both modules uncleaned, then clean the test module, wait 30 minutes for the temperature of the cleaned module to revert back to operational levels (cleaning will artificially cool the module leading to artificially better performance), then perform I/V curve measurements on the cleaned module.
It's good practice to perform 3 I/V curve tests on each module just in case one or two of the results are affected by external factors.
The I/V curve results as well as the weather data, time of testing etc then need to be recorded in a spreadsheet and extrapolated to STC conditions.
From there you can work out (1) the impact of the module cleaning on performance and also (2) how the cleaned modules are performing --> this is useful information for site performance analytics.
After this, I/V curve testing should be done on both reference and test modules at regular intervals (e.g. every 1-2 weeks) WITHOUT cleaning any modules. This allows us to determine the 2nd part which is how long the module cleaning performance improvement lasts.
If the testing is performed correctly (based on the guidelines above), from this process you’ll know exactly:
How much module cleaning impacts module performance. In industrial areas, performance can easily improve by 5% after cleaning
How well cleaned modules are performing (this data can be very useful if there is a potential module degradation issue or underlying module problem)
How long the module cleaning impact lasts
From this data we can then define the module cleaning strategy for any site.
We have I/V curve testing procedures and template spreadsheets for converting I/V measurements to STC conditions available for anyone interested. Please contact us if you'd like to know more.


Comments